
How Can We Help?
Farm-to-Hunger Relief Programs: Measuring Impacts
Evaluating and conveying the impacts of farm-to-hunger relief programs is important not just for reporting requirements but garnering support to further build the program’s impact. Diversifying data collection for monitoring cross-disciplinary impacts can guide strategic planning; find challenges, areas of improvement, and where to invest resources and seek support. Showing these broad impacts that exemplify the interdisciplinary nature of public health and food system sustainability helps contextualize the “big picture” of the program’s value to its participants and other stakeholders. In 2020, Harvest Against Hunger (HAH)’s Farm-to-Food Pantry (F2FP) program began convening a separate workgroup of alternative metrics of the program’s impacts beyond total weight of produce procured.
HEALTH
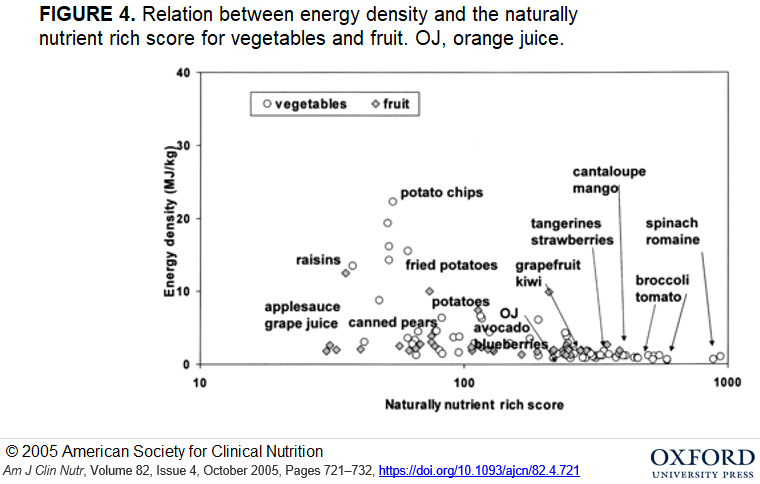
While the health benefits of increasing fresh fruit and vegetable access is already universally accepted, the emphasis on local produce in a farm-to-hunger relief program is for its higher nutritional value the more freshly harvested it is. Vegetables can lose up to 77% of their Vitamin C content 7 days after harvest. Naturally Nutrient Rich (NNR) scores are a measure of nutrient density that HAH’s programs have explored. F2FP partner NEW Hunger Coalition found that the average NNR score of produce most often purchased through the program in 2016 (including kale, carrots, and sweet potato) was 13.02, compared to 2.35 for bulk produce usually gained from larger-scale donation programs (e.g. potatoes, apples, onions).
ENVIRONMENTAL
Considering the carbon emissions from producing and transporting food, the environmental benefits of supporting a more localized, less industrialized food system are important to highlight. Food miles, the distance food traveled from farm to consumer, is one simple metric to show how locally grown food minimizes the organization’s carbon footprint. Food waste reduction is also a notable strategy of farm-to-hunger relief programs that has also been identified as a major component of reducing global carbon emissions. Besides asking farms roughly what percentage of the crops they delivered to the program were crops that they had no other market for and would have otherwise discarded (or composted), the Whole Earth Calculator helps quantify carbon emissions and water usage saved from recovered food.
ECONOMIC
The value of farm-to-hunger relief programs is especially of interest to stakeholders in the local agricultural economy. King County’s Local Food Initiative reported that more than half of King County farmers relied on additional income sources to support their operations and families, yet locally-produced foods sold at King County farmers markets make up just 3% of the local food market–so a supplementary market from programs like the King County Farmers Share can improve these numbers. For hunger relief partners, the financial value of building a local farm relationship shows in more flexible wholesale prices of produce over time, plus an even lower cost per lb of all procured food, including donated and gleaned pounds. For example, for F2FP in 2019, the average price paid for purchased produce was $1.07/lb, while incorporating gleaned and donated produced drove that total value down to just $0.21/lb.
SOCIAL
Social impact builds sustainability into the program through the relationships developed between farms and hunger relief organizations. However, enumerating or visualizing these impacts are less straightforward. Besides gathering verbal testimonials from program partners, a few evaluation options include mapping out the web of relationships between partners in your program with platforms like Kumu or ArcGIS StoryMaps or conducting analysis through Ripple Effects Mapping or Social Network Analysis.